Comfortable or Correct?
“Most days we’d rather be wrong with the crowd than be right by ourselves."
-James Clear | Atomic Habits
I’ve laid out the arguments in the prior post why the human element can cause issues in sticking to any investment approach. Often, the human element gets lost in the three-fund discussion. It’s much easier to be a long-term investor when returns are good!
When our peers and friends explain that they’ve found a better way, we often listen. I’ve noticed high amounts of confirmation biases in posts, blogs, and in-person conversations within various communities I serve. Yes, simplicity and costs are beneficial. I’m an advocate for a part of any investment approach to have inexpensive, broad investment exposure. The problem is there are shortcomings in any investment approach. While being a good start the three-fund portfolio fails to be the holy grail of investing.
The first element that often seems to come up is how the portfolio is almost free to investors (when including securities lending it can be). That is true. The investment cost for an investor in the allocation is 0.06% or better put for every $1,000,000 the cost is $600.
The second element is the concept of broad market diversification it offers. There are about 10,000 stocks and 8,600 bonds held in the three funds. While a lot of holdings, does that equate to diversification?
The answer is not really.
The three-fund portfolio has a 75% of it’s allocation to stocks is in the US. If you do an analysis of the holdings and where they fall in the size and style category from Morningstar, the issues deepen. We find that approximately 75% of all the stock holdings are in the large stock bucket. Then within the stock sector Technology is 20% of the entire stock exposure. There lies one of the first issues to explain, market cap weighting.
Market Capitalization: The Good, Bad, and Ugly
Market Capitalization Weighting is the structure of many of the largest and widely held investments. What is a market cap weighting methodology? Market Cap weighting is a collection of investments (think stocks or bonds) based on the larger a company (or total debt issuance if a bond) in size the larger the percentage of the total basket of holdings. While smaller holdings receive smaller weights. An excellent overview video can be found in the link below.
https://www.investopedia.com/terms/c/capitalizationweightedindex.asp
A market cap approach assumes market efficiency. The market is not efficient; if it was efficient for every amount of extra risk an investor takes, they should get more return. Dr. Robert Haugen produced research in the 1980s-1990s that showed stocks do not yield returns commensurate with their volatility [risks]. His paper The Effect of Volatility Changes on the Level of Stock Prices and Subsequent Expected Returns can be found here. Dr. Eugene Fama and Dr. Kenneth French professors at the University of Chicago Booth School of Business, produced research in 1992 that there is no relationship between beta [risk] and stock returns. Fama and French are most recognized for their Fama–French three-factor model. The model has commentary on the Boglehead forum here. In their paper, Analyzing Valuation Measures: A Performance Horse-Race over the Past 40 Years Wes Gray and Jack Vogel find, “Across the board, the historical evidence is clear: cheap stocks have outperformed expensive stocks–by a wide margin….This historical spread in returns, which has been repeatedly and consistently observed over time, has been labeled the value anomaly by academic researchers… Great minds can disagree on the explanation, but nobody can dispute the empirical fact that value stocks have outperformed growth stocks by a wide margin over time.” A Longboard Asset Management study finds that 20% of all stocks account for all the gains of the market from 1989-2015. 40% of stocks lose money over their lifetime. For the sake of brevity and space, these findings amongst many others prove that market capitalization weighting is profoundly sub-optimal, and the stock market is not completely efficient.
A final issue with market cap weighting is one that is talked about less, but equally as important is the idea of pure market cap weighting vs. float-adjusted weighting. The float-adjusting is just looking at how tradeable a company is and how many shares are outstanding. Pure weighting is straightforward as outlined above, while float-adjustments was implemented in 2005 by Standard & Poor’s on many of its indices. Float-adjusted value weighting has replaced pure value-weighting as the dominant index weighting scheme. Float adjusting is designed to help with effective trading (also increase capacity for funds to gather assets let’s be real) but may cause distortions and not accurately track like the previous pre-float. So why does this matter? The indices are still using a track record before the change, and most folks don’t seem to understand the difference. The move and adjustment seems a little like bait and switch since pre-2005 the way the indices were weighted and post-2005 are very different. An example to drive home the point is owner-operator companies are hurt under the float-adjusted model. A float-adjusted index underweights these companies when the float (available shares to buy/sell) is too small because owners are majority owners. Professional investors have made the case in the past for insider ownership of a company as being an attractive characteristic. You lose that in a float-adjusted index. Is it a big deal? Perhaps, only time will tell, but the returns since 2005 for many of these indices have been strong.
Is the market trying to be more efficient over time? Yes, it is always striving towards efficiency, but as we talked prior if there is a human element the market will never be completely efficient. Put in simpler terms, the daily price of Apple Stock might be very efficiently priced. Yet, the macro level of Emerging Markets vs. USA stock valuation might not be.
“Markets are micro efficient, but macro inefficient.”
-Paul Samuelson | The Father of Modern Economics
What is Diversification?
So, coming back to diversification. There are two issues with the Boglehead approach. The first is that even a 60/40 stock-bond mix has about 90% of the risk coming from the stock portion. So there is little actual diversification offered. You are actively taking two large bets to be successful: First, is the US performance drives everything. Second, the largest companies and government bonds must do well for you to succeed. Those two items make up over 60% of what is owned in the three funds. It’s great there are 18,600 holdings, but those holdings boil down to those two categories. The investment term correlation comes into play here. A 1.0 correlation is perfectly correlated. Our 60/40 mix is 0.97 correlated to the S&P 5001. In non-financial terms, whatever the S&P 500 does that’s what you can expect, there is less diversification offered in the three-fund 60/40 combination than you would think holding 18,600 various different stocks and bonds. Let’s review the various economic environments, we as investors can face in figure 1.
- Inflationary Stagnation – Think 1970’s where we see inflation (prices going up) and a recession
- Inflationary Boom – Think post-2001 through 2006, rapid growth favoring cyclical businesses and commodities (Ex: Energy & Metals)
- Disinflationary Bust – Think 2007-2009 Great Financial Crisis flight to safety as any risk is punished
- Disinflationary Boom – Think 2009 – Today US Stocks & Bonds are in favor
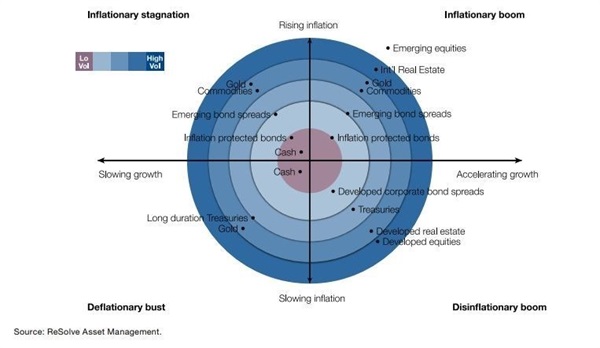
Figure 1
By only owning the three-fund portfolio you are making a bet that you will always be in the disinflationary boom. While all four do not occur in similar timeframes, one must understand you’ve designed an investment strategy for success in one of the four scenarios. Research shows that we as humans are good at predicting which will occur and when, so it seems foolish to build a concentrated investment strategy that works well only in one environment.
Rick Ferri in his interview titled 3-Fund Portfolio the Simplest Way to Best Return even discusses what he would add to the three fund model. “…The short-term TIPS [Treasury Inflation Protected Securities] fund is ideal for that because it takes away the risk of a jump in inflation without having term risk, which is the up-and-down movement of the fund itself. So it makes sense for that….Let’s go to the stock side, and let’s add a real estate investment trust, REITs. Real estate is a huge component of the U.S. economy. Commercial real estate is something like 13% of 14% of gross domestic product. It’s huge, but very small amounts of real estate are actually capitalized in equity. So, you’re not getting a full exposure to real estate if you just buy the total market index fund.” So even a die-heart supporter of the strategy has discussed what is missing. Rick is a proud and vocal supporter of simplicity and low cost, which you can still access adding in the two above strategies. My point is that there are holes in the allocation, and even those die-hard proponents agree.
An excellent example of diversification and what it means is told by ReSolve Asset Management in their piece called, Asset Allocation vs. Security Selection. While the title is very much financial jargon, they use an analogy that is so perfect. Think of the most beautiful forest and then the strongest, tallest tree, is the photo below what you pictured?

The problem is if you have a concentration of an investment in an area of the market and that area suffers, no matter how strong and tall your tree (aka your investment) you’ll be burned. The example ReSolve uses in their paper is the worst performing US Large Cap Stock Active Manager is US stocks (who was likely fired by clients) performed better than the #1 performing manager in the Emerging Markets. The takeaway? Even if you are the best, being overly concentrated you’ll be burned! The Boglehead Three-Fund Portfolio is very concentrated. When it works you look like a genius, when it doesn’t OUCH!
Love of Country
The United States stock market is about 40%-50% of the world stock market depending on where and when you look. A Nasdaq articlefrom 2018, has the US at 43%. BNY Mellon/Dreyfus in their Harnessing The Power of A Global Perspective has stated that 60% of the world’s bonds live outside of the US. The international bond market is the largest in the world. How much does the Three-Fund Portfolio have?
0%.
The average American investor like the three-fund portfolio falls victim to the term “home country” bias as shown in figure 2.
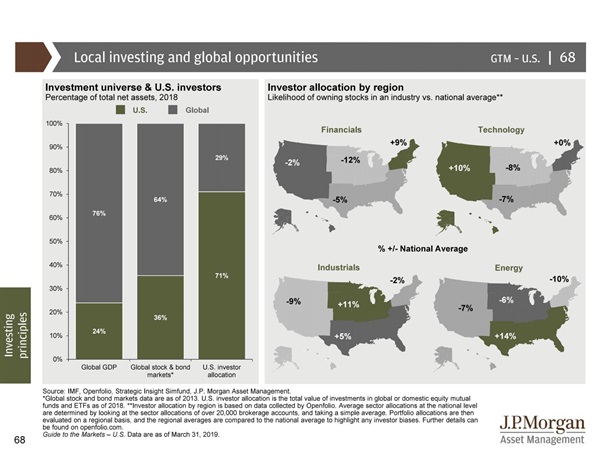
Figure 2
The three-fund investor is overexposed US in stocks by about 30% and again has 0% exposure in foreign bonds. Don’t feel bad though almost every investor in the world has the same issue. A great example of how damaging this can be just look to our neighbors to the north in Canada. They have the same bias to their home country (about 65% of their investments are in the Canadian market), yet Canada only makes up 1%-2% of the global stock market. The total return from January 1st, 2008- December 31st, 2018 in the Canadian stock market was -6.4% compared to the US at +116%. That HURTS! If you are thinking to invest more heavily in the US, that might be reinforcing a recency biases like we talked about in the prior post. The US has had our version of an entire lost decade. From January 1st, 2000 – December 31st, 2010 the total return of the S&P 500 was +4.6% and Canada’s market returned +182.9%2.
The US has outperformed foreign stocks by 1% per year over the past 70 years. The challenge is that all of that outperformance from the US has come entirely since 2009. The stat is from a tweet from Meb Faber and was pulled from Global Financial Distributors and verified from other sources. As you can see in figure 3 from 13D Global Research & Strategy rolling three year returns there are moments in time where the leadership changes from the US to Foreign. The US since 2009 has been the winner, and that is no surprise to anyone.
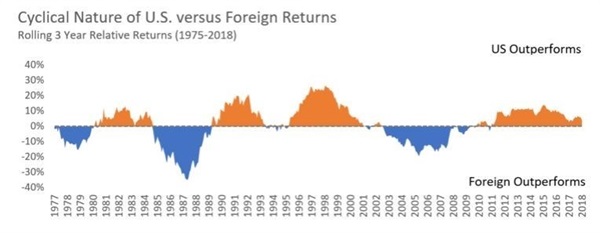
Figure 3
If you are not a fan of rolling three years, here’s the last 22 years from JPM Guide to the Markets in figure 4.
“History may not repeat itself, but it does rhyme.”
-Unknown – Thought to be Mark Twain
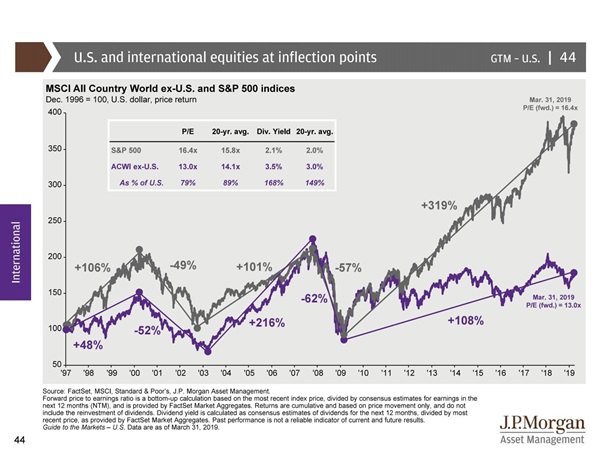
Figure 4
The US purist likes to argue that the S&P 500 a major market-cap-weighted index derives 43% of its sales from foreign markets and that investing in the US is investing globally. Rick Ferri has argued that, “…you can make the case that a U.S. investor has to pay all their bills in U.S. dollars. So you can make the case of having more a home bias, if you will, to the U.S…and you could make the case you really don’t even need foreign stocks to get more diversification. The only reason you’re doing foreign stocks is to get a currency hedge.”
The counterpoint to that is all foreign countries have sales coming from other countries as well as the United States. The US’s biggest trading partners are China, Mexico, Canada, Japan, and Germany. See figure 5 that globalization works both as a pro-US argument as well as an anti-US argument. While a little dated, the data is worth sharing.
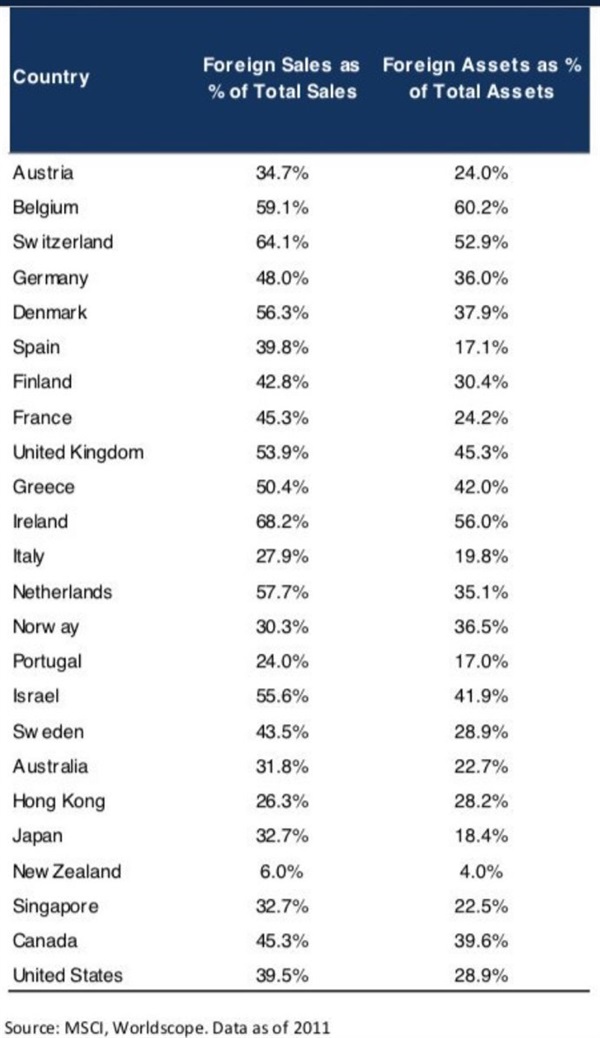
Figure 5
“If you torture the data long enough it will confess to anything.”
-Ronald Coase |Professor and Nobel Prize winner in Economic Sciences
Price vs. Value
So, the focus should then shift to what the price or valuation is, right? The biggest flaw in what Rick and others are saying is he never takes into consideration the value or price that someone pays by focusing so heavily on the US. We again do not live in an efficient world. So, we should be looking at what is cheap vs. what is expensive. You can use intelligence, research, and reasoning to move your dollars to areas which are least expensive.
According to Star Capital in their publication An Improvement towards Traditional Value Indicators? Predicting Stock Market Returns using Shiller CAPE, “In all countries, a relationship between fundamental valuation and subsequent long-term returns can be observed. [Star determined that] long-term stock market performance can be best determined using CAPE (Cyclically Adjusted Price to Earnings) and PB (Price-to-Book). The relationship between CAPE and subsequent long-term returns is not only visible in the S&P 500. Research by Bunn and Shiller [2014], Keimling [2005] and Klement [2012] suggests that the relationship also exists on a sector level, in other international equity markets, and in the emerging markets.”
Price to Book (P/B) has long been a value indicator and publicized by Dr. Eugene Fama and Dr. Kenneth French as well. The P/B ratio has a long-standing relationship with value investors and used by market analysts. Dimensional Fund Advisors (DFA) is the most famous asset manager who uses this approach. American Economist Robert Shiller developed cyclically Adjusted Price to Earnings (CAPE). Dr. Shiller research concluded that by dividing the current price of a stock [market index or country] by its average inflation-adjusted earnings over the last ten years helped to predict future returns. The US market has been above its long-term average CAPE of 16.9 for an extended period; today we are at around 30 (see figure 6) which again points to criticism that the indicator doesn’t work. As the S&P 500 has gained well over 100% since its overvaluation. The point is not to trade out of a market that is expensive, but when something is cheap, that’s an indicator of value. The blend of the two measures has shown to help in identifying areas that are cheap. Star Capital continues “a low CAPE of below 15 was always followed by greater returns than a high CAPE. While attractive valuations were followed by high returns, CAPE levels of more than 30 led to low returns of 0.5% on average.”
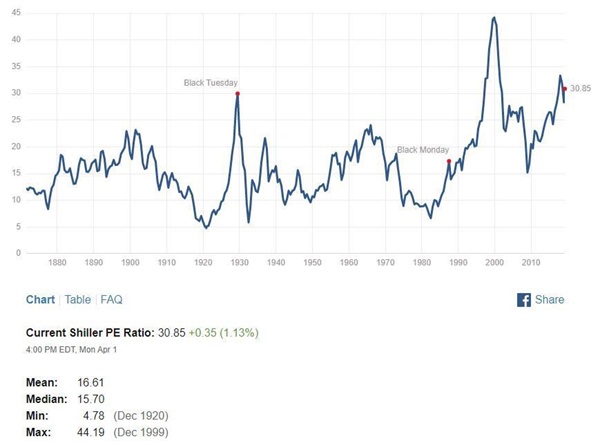
Figure 6 - link to the measure
P/B and CAPE has come under fire due to accounting changes and fundamental methodological weakness. Star Capital addresses these concerns for CAPE much better than I could, and I’ll defer to their work as they make a very thoughtful and compelling case. Research Affiliates (a global leader in quantitative research and asset allocation) also discusses the CAPE ratio and why it still matters here. There are many staunch supporters on both sides of the argument; some state that all these indicators have been arbitraged away. As with any data, it’s use should be in tandem with various other measures. I’m NOT advocating that these are the end all be all for any decision, but part of an evidence-based decision-making process because there has been empirical evidence with proven research behind why it works.
“We sometimes have a sense for what will happen, but don’t know when. Time is something I discard….I believe that everything an investor does fall under two headings: Asset Selection and Cycle Positioning. Asset Selection- holding more of the things that will do better and less of the things that will do worse. Cycle Positioning – trying to have more of your capital invested and more aggressively when the odds are favorable, and less of your capital invested more defensively when the odds are against you. We can know something about the odds, that doesn’t mean we are going to be right. Or right, right away. That can enable us to effectively cycle position ourselves, by understanding where we are in the market cycle.”
-Howard Marks – Interview on Masters in Business | Bloomberg Radio
As I close why does someone who views planning as the essential essence of a CFP®’s job talk so much about investments? Research Affiliates (RAF) in October of 2016 write The 5% Challenge. The findings since from over 50,000 portfolios were that about 14% of the results exceed the expected returns of 5%. For the next decade and the typical portfolio has only a 1.5% chance of exceeding 5% annualized. Does RAF have a vested interest in publishing data like this? Yes, but understanding how expensive the US is and the how overloaded the “typical” investor is on the S&P 500, it’s hard to argue with the results. As of the the first quarter of 2019, the Boglehead three-fund portfolio is tracking ahead of schedule at 8.38% annualized since November 1st, 2016, I’ll keep updating this into the future via articles and videos.
Outcomes Matter
As a financial planner, when I create a plan for clients my job at the root of investing is to ensure they do not run out of money and help them accomplish their goals and vision for their future. Most financial planners use a planning tool that drives runs a Monte Carlo simulation. The easiest way to think about a Monte Carlo simulation is that it is a series of thousands of random computations (excellent, good, bad, terrible) to arrive at a probability of success. There are many elements outside of investments (like savings rates which are more important), but the investment allocation [construction], diversification [zig vs. zag], and cost all matter. Part of my job is to do my research, due diligence, and evaluations of various strategies to understand one question. What are the returns that most people need to achieve success? I’d say typically they fall between 5%-7%. I believe that a thoughtful, research-based, academically-proven and diversified approach better achieve client plan success. That’s what truly matters; people want to know “Am I going to be okay?”. I do not believe that being the cheapest and risking retirement is appropriate. No one would like to hit 80 and be told, well our investments are the cheapest, but we cannot maintain your lifestyle. Next, I’ll explain an alternative investing approach that I use and talk with clients about. We’ll cover costs, diversification, and more. As my friends at ReSolve Asset Management would say, “With investing, you can either be comfortable or successful – but not both.”
Summary
- The three-fund portfolio is designed for market efficiency, and the market is not entirely efficient
- The US market dominates the Three-Fund-Portfolio, and the US out-performance has all come since 2009
- The three-fund portfolio has two concentrated bets US Large Stocks and US Government Bonds
- Valuation Matters
- Success in investing involves accomplishing goals
1 (Source: Kwanti 2019)
2 (Source: Kwanti 2019 S&P Index 500 TR and iShares MSCI Canada ETF)